
Understanding the System Health Check
The system's Health Check functionality provides a real-time overview of the connectivity and operational status of various integrated components and services. This feature allows administrators to quickly identify and troubleshoot potential issues, ensuring continuous system availability and performance.
To access the System Health Check:
Prerequisites:
-
You must have successfully logged into the IDMS application.
-
A scheduled Health Check has been successfully run.
-
Acknowledge System Warning:
-
Click the "I Understand, Continue" button to proceed to the main dashboard.
-
-
Navigate to System Connections:
-
From the main dashboard, locate the left navigation pane.
-
Under the ADMINISTRATION, click on "System Connections".
-
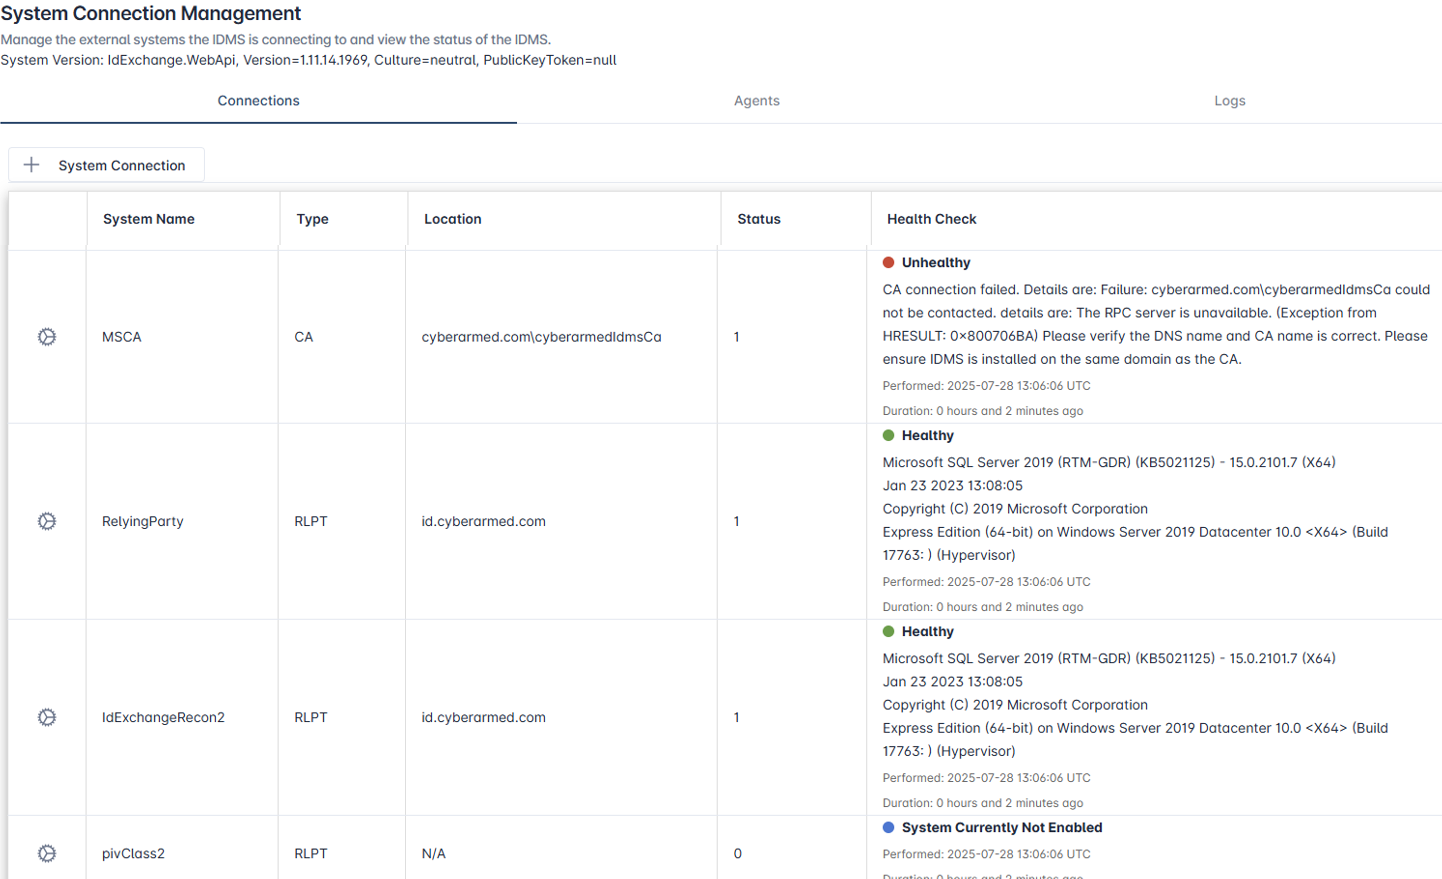
Result: The "System Connection Management" screen will load, displaying a column with the Health Check Information for the respective system.
-
Interpreting Health Check Results
The Health Check status is presented in a tabular format, offering detailed information for each monitored system or service. The columns provide specific insights:
-
System Name: (e.g., "RemoteDir") This column identifies the specific component or application that is being monitored.
-
Type: (e.g., "EXTIDREPOS") This indicates the category or type of the external system, such as an External Identity Repository.
-
Location: (e.g., "id.cyberarmed.com") This displays the specific network address or URL of the service or endpoint that the health check is configured to reach.
-
Status: (e.g., "0") This column provides the active/disabled status status code for the system. For example, a value of '0' signifies that IDMS will not attempt to make a connection to the system because that respective system has been disabled.
-
Health Check: (Column with colored indicators and detailed messages) This crucial column presents the current operational status of the component, accompanied by additional information. As illustrated in the screenshot, one possible status is:
-
Blue Dot - System Currently Not Enabled:
-
Meaning: This indicates that the health check for the component is inactive, or the system itself is not configured to be actively monitored at this time.
-
Example (from screenshot): "RemoteDir" displays this status.
-
Details provided: Includes a timestamp (e.g., "Performed: 2025-07-27 12:52:00 UTC") indicating when the status was last recorded, and its "Duration" (e.g., "0 hours and 6 minutes ago").
-
(Note: While this screenshot specifically shows the "System Currently Not Enabled" status, a full health check dashboard typically also displays Green dots for "Healthy" status and Red dots for "Unhealthy" status, providing success messages or error details, respectively.)
-
Usage and Troubleshooting:
Administrators should regularly review this dashboard. A "Healthy" status (not shown in this specific screenshot but indicated by a green dot) confirms normal operation. If a component shows "System Currently Not Enabled," verify if it's intentionally offline or if its monitoring needs to be activated. An "Unhealthy" status (indicated by a red dot) signals an active issue that requires investigation, using the provided error details to diagnose the root cause.