
The TAC report provides an enterprise view of all the credentials issued. It lists both the user and credential details along with status information. This report is useful for:
-
Determining the number of active credentials that are issued
-
View which card policies are being used
-
Understand which credentials are close to expiration
-
View when the credentials were issued
This report is accurate as it will perform validations on each card to ensure the card is active and to obtain the latest certificate information. It is the only CMS report that will aggregate card data, user information, and the certificate detail.
To Run the Total Active Credential Report
|
Item |
Procedure |
Example |
|---|---|---|
|
1 |
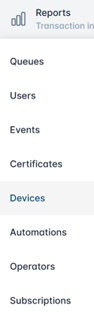
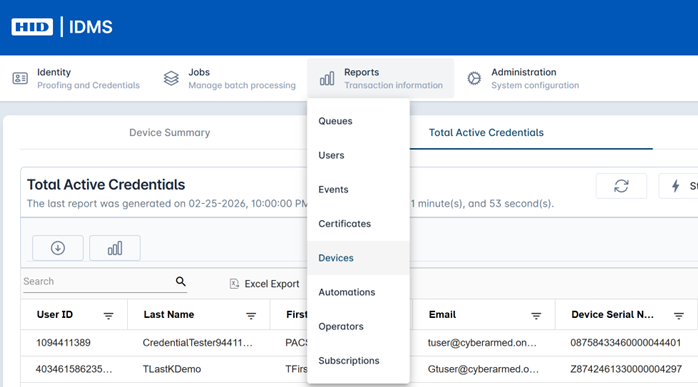
Login with the Reports Officer role and go to Reports, then select Devices. |
|
|
2 |
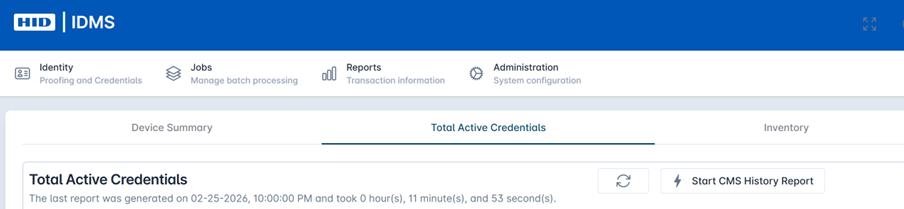
Click the Total Active Credentials tab. |
|
|
3 |
Press the Refresh Button. To run the job to obtain the most updated data, press the Start CMS History Report button. This process obtains the latest data from the systems. NOTE: This process can take several minutes up to several hours to complete. |
|
|
4 |
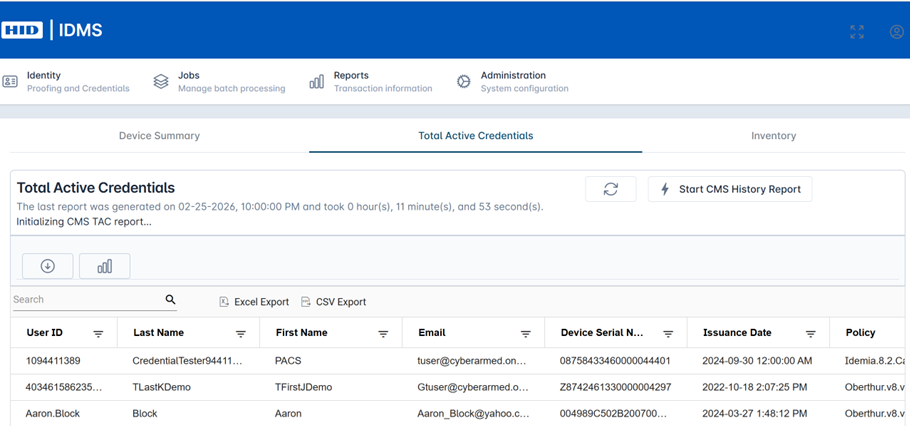
The details are listed in the table below. You have the ability to filter and download the information. Fields include User ID, First Name, Last Name, Email, Device Serial Number, Issuance Date, and Policy. |
|
|
5 |
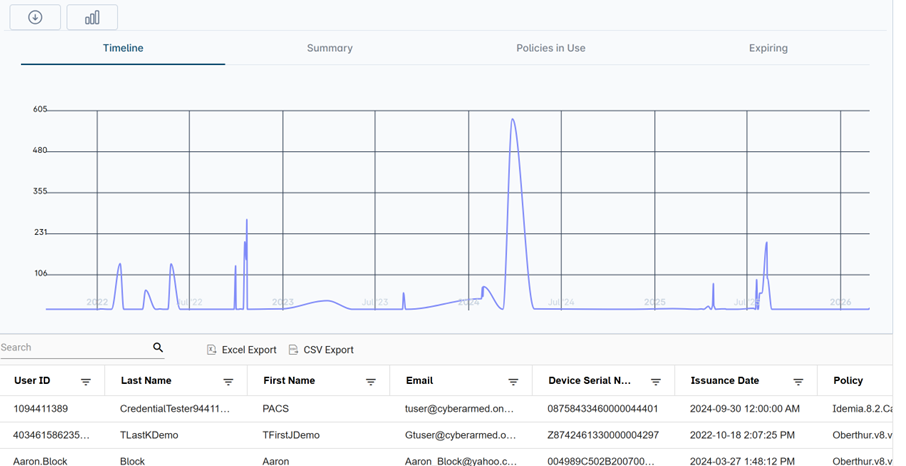
Select the graph icon to create a graphic representation of the data and toggle between options. |
|
General Dashboard Features and Navigation
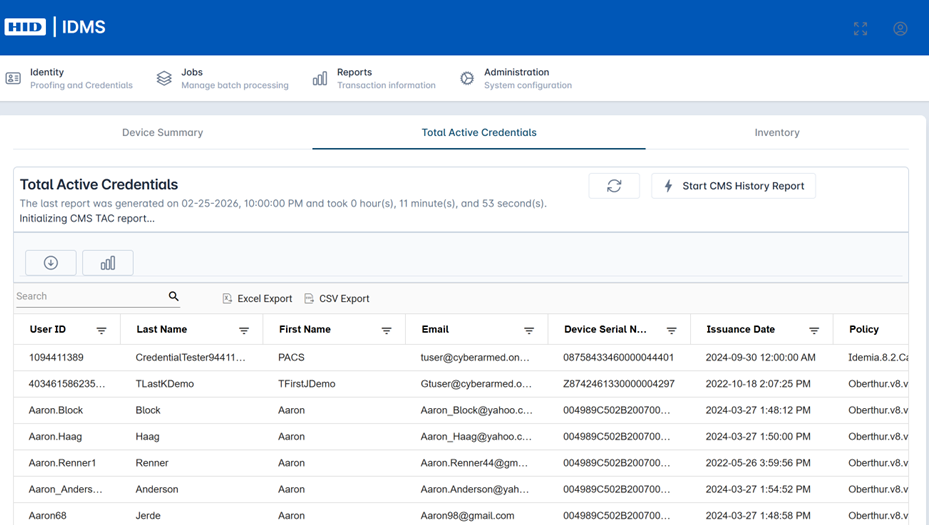
The following highlights the dashboard and reporting features:
-
Full report refresh: Retrieves the entire report data from the server.
-
Start CMS History Report: Initiates the running of the entire report.
-
Statistics refresh: Only retrieves the statistics for the data.
-
Download: Saves the data to the user’s hard drive.
-
Dashboard Controls: Will show or hide the various dashboards to assist with the visualization of the data.
-
Search: After clicking the refresh button, filter the data table with a specific search query.
-
Page: Move to different locations in the data table.
-
Dashboard Views Control (graph icon): Click the different tab to view different visual summarizations of the data.
-
Dashboard: View the data in a graph format.
-
Data Detail: View the details of the transaction.